On December 2nd, 2019, SBI Cards and Payment Services, a subsidiary of the State Bank of India, filed its prospectus with the Securities and Exchange Bureau of India ahead of its upcoming IPO. We took a closer look at the prospectus, and this is what we learnt.
In our analysis of the SBI Credit Card prospectus, we used our commercial due diligence framework to dig deeper into the offering, the the business, and the market as a whole.
- We discussed the current share capital, and the percentage split between SBI and the Carlyle Group. SBI will sell off 4% of the total shares, with the Carlyle Group contributing 10%, leaving them with 70% and 16% of the total shares, respectively.
- The Carlyle Group is likely to make ~₹60 B (~$840 M) from the sale of their 10%, valuing their 26% stake at 7x its 2017 purchase price.
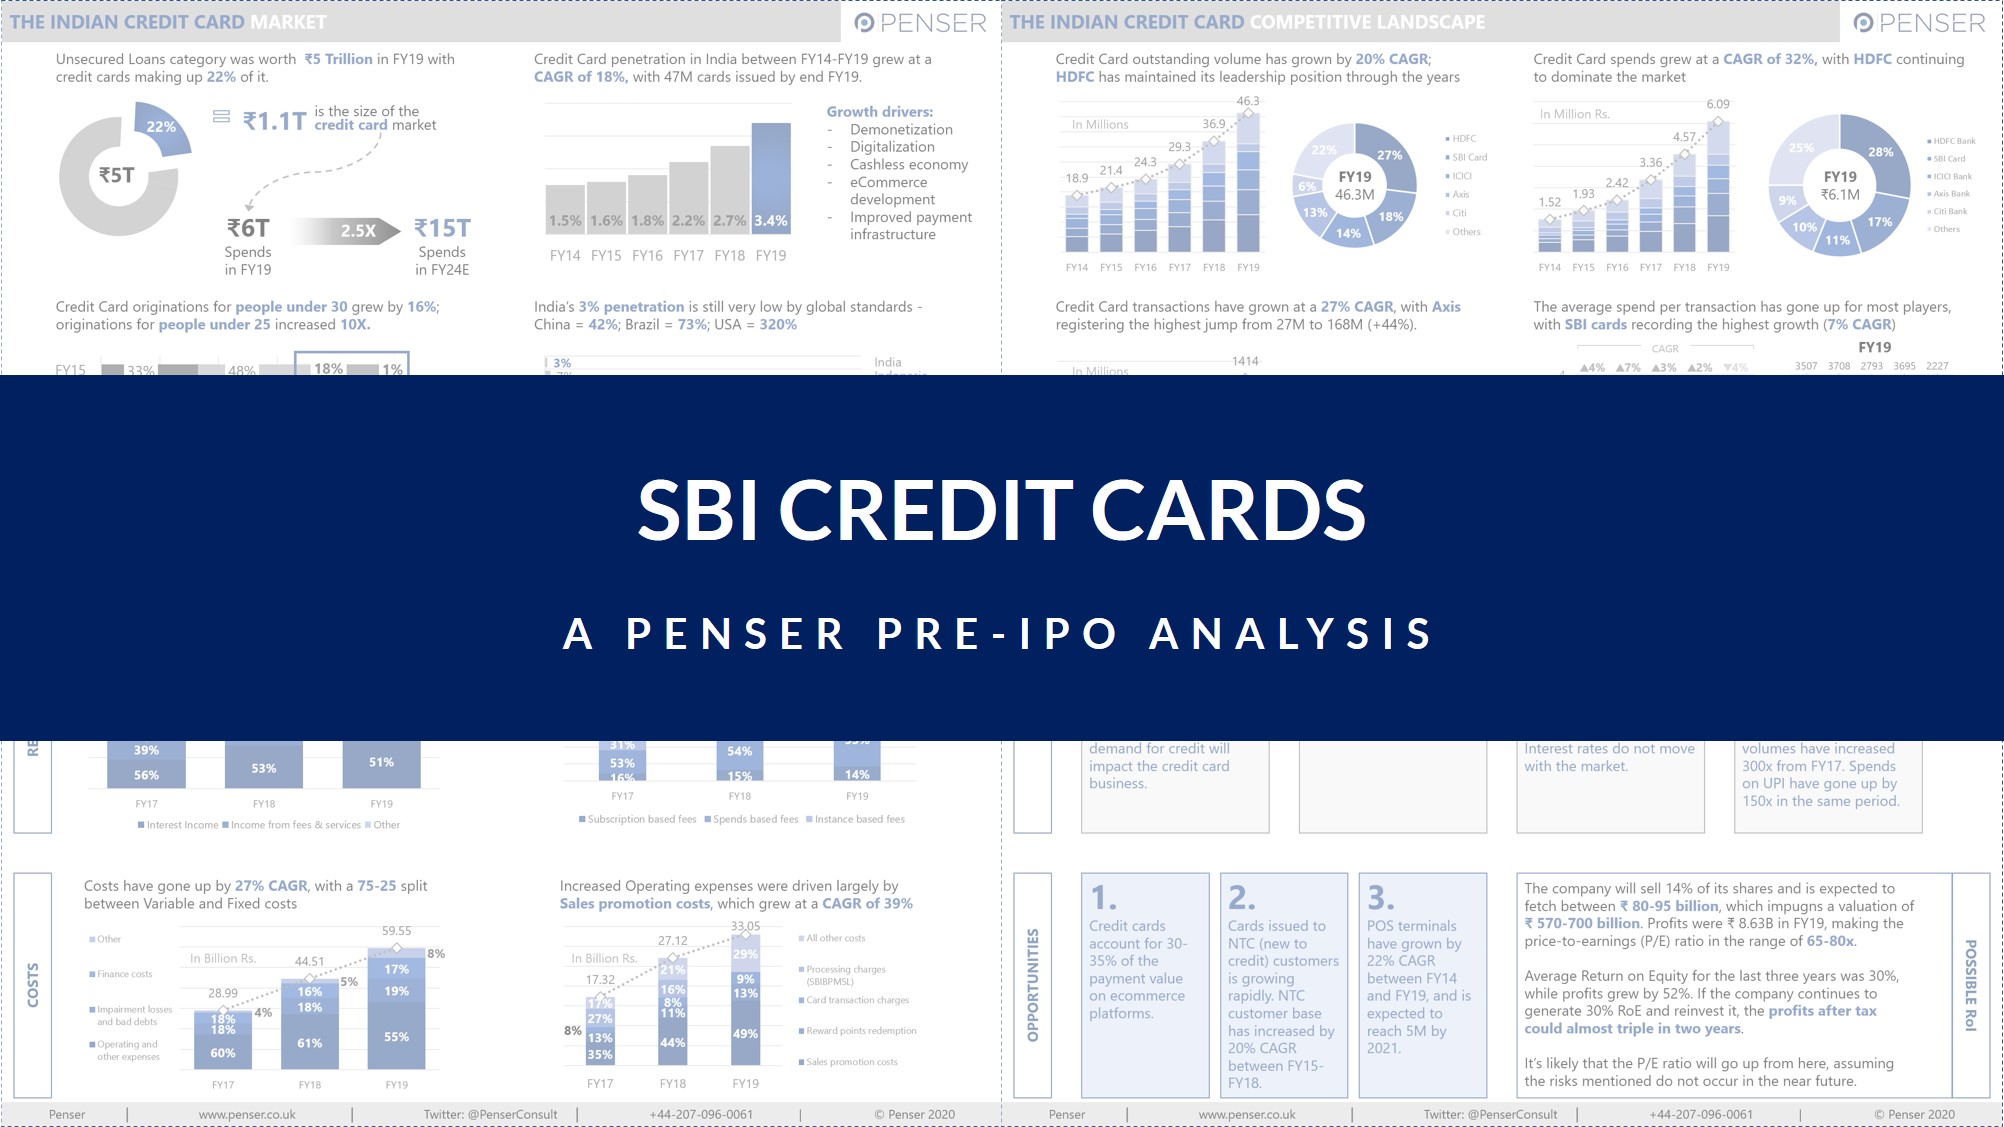
- We analysed the state of the Indian credit card market today –
- The credit card market in India is worth an estimated ₹1.1T (~$15 B), with credit card spending expected to increase by a factor of 2.5 to hit ₹15T (~$210B) in FY24E.
- Credit card penetration grew at a CAGR of 18%, with 47M cards issued by the end of FY19. Card penetration now stands at 3%, which is low by global standards.
- This growth in credit cards was likely driven by
- Demonetization,
- Digitalization,
- Cashless economy,
- eCommerce development, and
- Improved payment infrastructure.
- Credit card originations for people under 30 grew by 16%; for people under 25, by 10x.
- We then discussed the Indian credit card competitive landscape –
- Credit card outstanding volume grew by 20% CAGR from FY14-FY19, with HDFC continuing to maintain its leadership position through the years.
- In the same period, credit card spending grew at 32% CAGR; HDFC led the market in this metric as well.
- Credit card transactions grew 27% CAGR, with Axis registering the highest jump – a 44% increase from FY14.
- The average spend per transaction went up for most players, with SBI cards recording the highest growth (7% CAGR).
- We took a closer look at the SBI Credit Card business model, which had a steady upward trend over the last three years (FY17-FY19).
- The SBI Card’s revenue grew at 28% CAGR, with most of it coming from Interest and Fees & Services.
- The increase in Fees & Services revenue was largely driven by spend-based fees and instance-based fees.
- Costs have also gone up at a CAGR of 27%, with a 75-25 split between Variable and Fixed costs.
- The increased operating expenses were driven by sales promotion costs, which grew at a CAGR of 39%.
- The SBI Card’s revenue grew at 28% CAGR, with most of it coming from Interest and Fees & Services.
- Wrapping up, we took a look to the future and outlined what we thought were the risks and opportunities with the business –
- Risks:
- Slowdown in economic growth and parameters like consumer confidence, unemployment rates, consumer spending and demand for credit will impact the credit card business.
- A weak distribution channel and scalability model would adversely affect the business.
- An increase in regulations could impact profits. Today, interchange fees and interest rates of credit cards are not regulated. Interest rates do not move with the market.
- The rapid expansion of UPI payments and payment wallets is moving the economy towards a cashless future. UPI volumes have increased 300x from FY17. Spends on UPI have gone up by 150x in the same period.
- Opportunities:
- Credit cards account for 30-35% of the payment value on ecommerce platforms.
- Cards issued to NTC (new to credit) customers are growing rapidly. NTC customer base has increased by 20% CAGR between FY15-FY18.
- POS terminals have grown by 22% CAGR between FY14 and FY19, and are expected to reach 5M by 2021.
- Risks:
- And lastly, we took a stab at the possible RoI that could be generated from the sale of these shares –
- The company will sell 14% of its shares and is expected to fetch between ₹80-95 billion (~$1.1-1.3 B), which implies a valuation of ₹570-700 billion (~$8-10 B). Profits were ₹8.63 B (~$121M) in FY19, making the price-to-earnings (P/E) ratio in the range of 65-80x.
- Average Return on Equity for the last three years was 30%, while profits grew by 52%. If the company continues to generate 30% RoE and reinvest it, the profits after tax could almost triple in two years.
- It’s likely that the P/E ratio will go up from here, assuming the risks mentioned do not occur in the near future.
We are excited to see how successful the IPO is. Rest assured, we’ll be back with an update when it happens!
If you’d like to know more about Penser, please contact us, or visit our due diligence, digital transformation and strategic planning service pages.